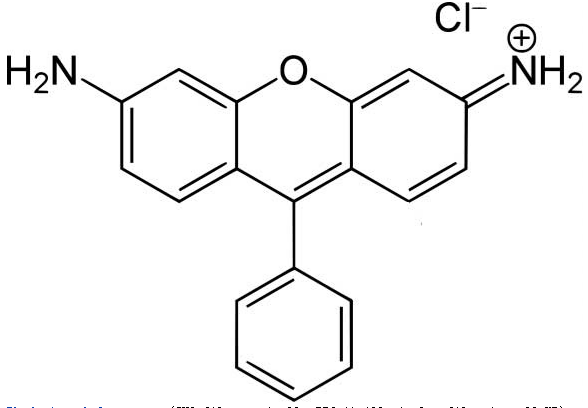
Rhodamine 123 (pron.: /ˈroʊdəmiːn/) is a chemical compound and a dye. It is often used as a tracer dye within water to determine the rate and direction of flow and transport. Rhodamine dyes fluoresce and can thus be detected easily and inexpensively with instruments called fluorometers. Rhodamine dyes are used extensively in biotechnology applications such as fluorescence microscopy, flow cytometry, fluorescence correlation spectroscopy and ELISA.
The absorption of Rhodamine 123 peaks around 505 nm and luminescence is tunable around 560 nm when used as a laser dye.[1] Its luminescence quantum yield is 0.90.[2]
References
This optical absorption measurement of Rhodamine 123 were made by R.-C. A. Fuh on 06-19-1995 using a Cary 3. The absorption values were collected using a spectral bandwidth of 1.0 nm, a signal averaging time of 0.133 sec, a data interval of 0.25 nm, and a scan rate of 112.5 nm/min.
These measurements were scaled to make the molar extinction coefficient match the value of 85,200cm-1/M at 511.8nm (Eastman, 1993).
Fluorescence
The fluorescence emission spectrum of Rhodamine 123 dissolved in ethanol. The excitation wavelength was 480nm. The quantum yield of this molecule is 0.9 (Kubin, 1982). This spectrum was collected by on 06-19-1995 using a Spex FluoroMax. The excitation and emission monochromators were set at 1 mm, giving a spectral bandwidth of 4.25 nm. The data interval was 0.5 nm and the integration time was 2.0 sec.
Samples were prepared in 1cm pathlength quartz cells with absorbance less than 0.1 at the excitation and all emission wavelengths to uniformly illuminate across the sample, and to avoid the inner-filter effect. The dark counts were subtracted and the spectra were corrected for wavelength-dependent instrument sensitivity.
Notes
The literature fluorescence yield data are assumed to have been obtained in ethanol.Dixon, J. M., M. Taniguchi and J. S. Lindsey (2005), "PhotochemCAD 2. A Refined Program with Accompanying Spectral Databases for Photochemical Calculations, Photochem. Photobiol., 81, 212-213.
Du, H., R.-C. A. Fuh, J. Li, L. A. Corkan and J. S. Lindsey (1998) PhotochemCAD: A computer-aided design and research tool in photochemistry. Photochem. Photobiol. 68, 141-142.
Eastman Laboratory Chemicals Catalog No. 55 (1993-94), Fisher Scientific.
Kubin, R. F. and A. N. Fletcher (1982) Fluorescence quantum yields of some rhodamine dyes. J. Luminescence 27, 455-462.

以下内容转载自小木虫 哥特复兴VS [1]Han-Dong Sun,Yi-Ming Shi:LCUV-Guided Isolation and Structure Determination of Lancolide E: A Nortriterpenoid with a Tetracyclo [...
人是能够思想的苇草 帕斯卡尔 人只不过是一根苇草,是自然界最脆弱的东西;但他是一根能思想的苇草。用不着整个宇宙都拿起武器来才能...
1 目的 规范TENSOR 27红外光谱仪的操作程序,正确使用仪器,保证设备安全和检测的顺利进行。 2 使用环境 电源电压:85~265V,47~65Hz 温度范...

同一种微生物在不同的国家或地区常有不同的名称,这就是俗名。俗名在局部地区可以使用,但不便于交流,容易引起混乱。为在世界范围...