In an IR spectrometer molecules are irradiated with a whole range of IR frequencies but are only capable of absorbing radiation energy at certain specific frequencies which match the vibration frequencies of the molecule. The energy absorbed by a molecule is rapidly dissipated. The excited molecule loses its energy in less than 10-6 seconds. The energy is either transformed into kinetic energy as result of collisions or released again as photon. As the direction of the emitted photon is random in space, and because the absorption process can be repeated for such a photon on its way trough the medium, it can be seen that for a once-absorbed photon the probability of re-emerging from the medium in the direction of the transmitted beam is negligibly small. A spectrometer usually measures the radiation intensity as a function of the wavelength of the light behind a sample. At the vibrational frequencies of the molecules an intensity decrease is obtained and a transmittance or absorbance spectrum is plotted. In this way a sample can be characterized and allows to determine which chemical bonds are present.

FTIR spectrum of the Benzoic acid dimer recorded at room temperature 1 M CDCl3 solution. The wavelength is often expressed as some unit directly proportional to the photon energy, such as wavenumber which has a reciprocal relationship to wavelength.
A beam of IR radiation is produced and split into two separate beams. One is passed through the sample, the other is passed through a reference which is often the solvent. The beams pass through a splitter (the section mirror) which quickly alternates which of the two beams enters the monochromator. A monochromator is an optical device that transmits a mechanically selectable narrow band of wavelengths of radiation chosen from a wider range of wavelengths available at the input. The monochromator makes it possible to scan through the spectrum. Finally, the beams are both directed towards a detector. The two signals are then compared and a printout is obtained. A reference sample is used for two reasons: this prevents fluctuations in the output of the source affecting the data and this allows the effects of the solvent to be cancelled out.

A possible optical layout of a spectrophotometer.
Source
It is difficult to find a perfect source for a spectrophotometer. The most ideal radiation source would be one emitting constant energy over the whole IR region. Unfortunately as yet such sources have not been developed and so we have to do the best we can with the following ones:
The main disadvantage of all these sources is the very unequal energy distribution in relation to the wavelength. The energy emission curve for ‘black body radiation’ is as given in the following figure. The curve is temperature dependent and can be calculated from Planck’s formula. The curves for the above-mentioned sources can only at best be as good as a perfect Planck curve. As one wants a constant energy output from the monochromator a variable slit is necessary. The variation of the slit width has to be chosen in some way or another to be inversely proportional to the energy curve in order to be sure that a fairly constant amount of energy will reach the detector.
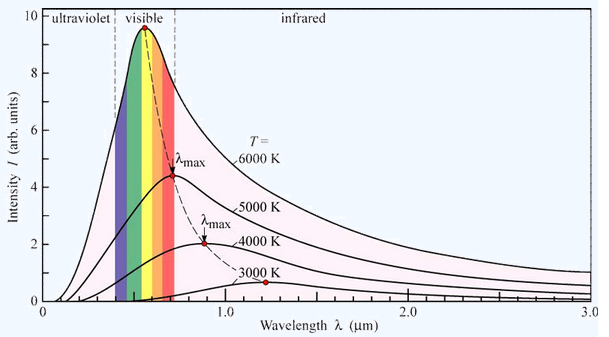
Spectral intensity distribution of Planck’s black-body radiation as a function of wavelength for different temperatures.
A relatively new laser source that could be used, is a high power fiber laser generating supercontinuum radiation in the 460 - 2500 nm spectral band (see figure ↓).
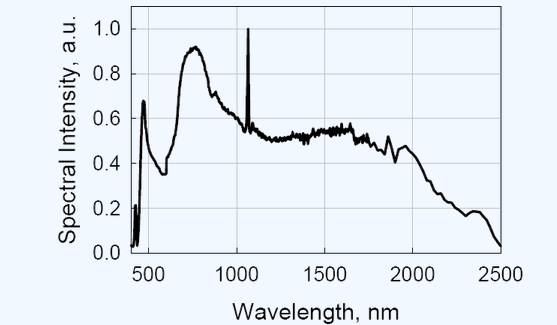
Typical optical spectrum of the SC450 on a linear scale. Between the 1100nm and 2000nm the spectrum is remarkably flat. This makes the laser possibly a good source for spectrophotometers .
Another measurement technique for collecting IR spectra is Fourier Transform Infrared (FTIR) spectroscopy. Instead of recording the amount of energy absorbed when the frequency of the IR radiation is varied by a monochromator, the IR radiation is guided through an interferometer. The purpose of the interferometer is to have a beam of IR radiation, split it into two beams, and make one of the beams travel a different (optical) distance than the other in order to create alternating interference fringes. A diagram of a Michelson interferometer is shown in the next figure.
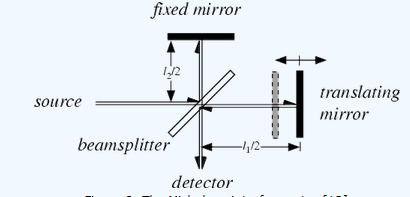
The Michelson interferometer.
The Michelson interferometer consists of four arms. The first arm contains a source of IR radiation, the second arm contains a stationary mirror, the third arm contains a moving mirror, and the fourth arm is open. At the intersection of the four arms a beamsplitter is placed, which is designed to transmit half the radiation that impinges upon it, and reflect the other half. As a result, the light transmitted by the beamsplitter strikes the fixed mirror, and the light reflected by the beamsplitter strikes the moving mirror. After reflecting off their respective mirrors, the two light beams recombine at the beamsplitter, then leave the interferometer to interact with the sample and strike a detector.
In a Michelson interferometer an optical path difference is introduced between the two beams by translating the moving mirror away from the beamsplitter. A general property of (optical) waves is that their amplitudes are additive. When the beams that have reflected off the fixed and moving mirrors recombine at the beamsplitter are in phase, an intense beam leaves the interferometer as a result of constructive interference. When the fixed and moving mirrors beams are recombined at the beamsplitter and the waves are completely out of phase, a low intensity beam leaves the interferometer as a result of destructive interference. A plot of light intensity versus optical path difference is called an interferogram. In fact, the interferogram is a measurement of the temporal coherence of the light at each different time delay setting. With the use of Fourier transformations it is possible to convert a signal in the time domain to the frequency domain (i.e. the spectrum). The fundamental measurement obtained by an FTIR is made in the time domain, which is Fourier transformed to give a spectrum (see figure). This is where the term Fourier Transform IR spectroscopy comes from.
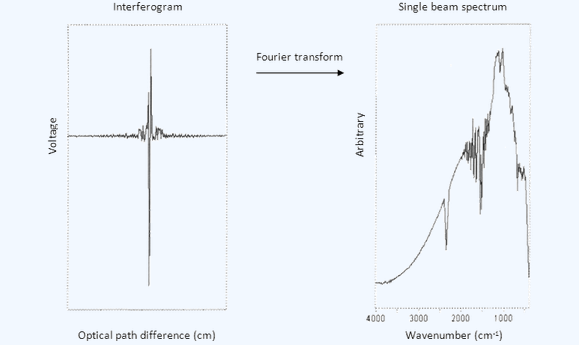
An Interferogram is Fourier transformed to give a spectrum .
FTIR spectrometers are cheaper than conventional spectrometers because building of interferometers is easier than the fabrication of a monochromator. In addition, measurement of a single spectrum is faster for the FTIR technique because the information at all frequencies is collected simultaneously. This allows multiple samples to be collected and averaged together resulting in an improvement in sensitivity. Because of its various advantages, virtually all modern IR spectrometers are FTIR instruments .
1 目的 规范TENSOR 27红外光谱仪的操作程序,正确使用仪器,保证设备安全和检测的顺利进行。 2 使用环境 电源电压:85~265V,47~65Hz 温度范...

以下内容转载自小木虫 哥特复兴VS [1]Han-Dong Sun,Yi-Ming Shi:LCUV-Guided Isolation and Structure Determination of Lancolide E: A Nortriterpenoid with a Tetracyclo [...
人是能够思想的苇草 帕斯卡尔 人只不过是一根苇草,是自然界最脆弱的东西;但他是一根能思想的苇草。用不着整个宇宙都拿起武器来才能...

同一种微生物在不同的国家或地区常有不同的名称,这就是俗名。俗名在局部地区可以使用,但不便于交流,容易引起混乱。为在世界范围...