1. First get the key from Mr Graham, then sign the log book before you start.
2. Switch on the PC.
Do NOT switch on the instrument yet.
3. Start Windows by typing WIN from the DOS prompt.
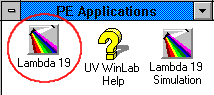
4. Select the Lambda19 icon in the PE Applications group by moving the mouse over the icon and giving a single click with the left mouse button.
5. Either, double click to start the application or hit Enter from the keyboard. At the same time switch on the instrument. Note that BOTH SAMPLE and REFERENCE compartments MUST BE EMPTY when the instrument is switched ON.
6. After a few minutes, you should see the following screen. It is necessary to wait until the instrument has completed its setup before proceeding. This is signaled by the Absorbance being displayed in the bottom status line. If you attempt to edit methods etc. before that time, a dialog box will appear saying that the instrument is not accessible!
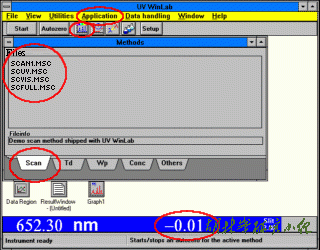
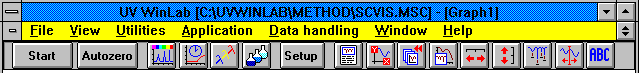
This is the main control screen for the programs and you should look at the small icons carefully to identify their meaning.
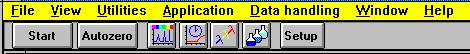
By selecting each Item in the Menu Bar you can see the scope of the program.
7. For a typical run, there are 3 methods saved on disk. These can be accessed in a variety of ways. Either double clicking on the filename in the window shown, from the small icon representing SCAN, or from the Application Menu, etc.
8. You need to set the appropriate wavelengths for your sample. As a guide, three methods have been stored, which can be used as a starting point.
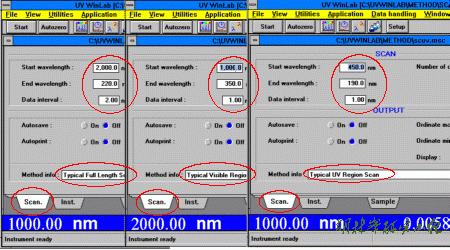
UV - (450 - 190 nm), single scan. Method scuv.msc
Visible -(1000 - 350nm) , single scan. Method scvis.msc
Full range -(2000 - 220nm), single scan. Method scfull.msc
Check and/or adjust the wavelength settings for your conditions. The last person may have altered these settings so check carefully.
If you want to run multiple scans, enter the number in the Number of cycles box. Then choose OVERLAY rather than SERIAL from the Display options given. For a full scan, check that the Data Interval is set at say 5-10 nm, for smaller ranges this can be reduced to 1 nm. If you want to save these settings, use a different filename to those above. Please leave the Autosave and Autoprint settings OFF.
9. Check the Instrument settings.
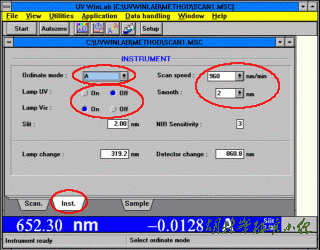
The highlighted Ordinate Mode type is set at A for Absorbance. Other options include T for Transmittance or %R for reflectance spectra. Check that the required lamps are on and that the scan speed and slit width are appropriate for your needs.
If you are not recording in the UV do NOT switch on the UV lamp.
10. Check the sample settings.
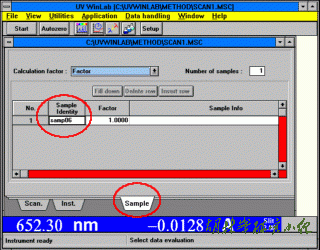
You can use any valid DOS filename. If you want to run a sequence, then use a filename ending with a digit eg samp001
11. Next, click on the SETUP button and WAIT for the instrument to adjust to the settings selected and the green START button to appear.
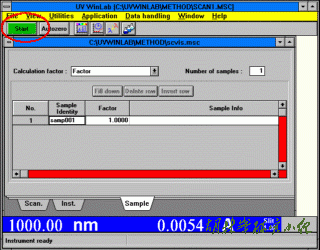
12. Finally, press the START button.
A dialog box will appear asking whether you want to run AUTOZERO. For double beam recordings this is NOT necessary, so you can select NO. If you want to record a baseline with your solvent, then fill two cells with solvent ONLY and select YES.
13. If you selected AUTOZERO you will be asked to insert your sample and finally your spectrum should appear.
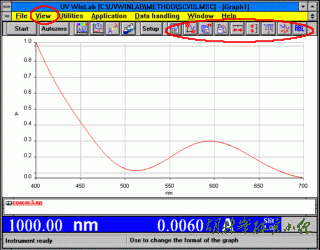
Co(acac3)
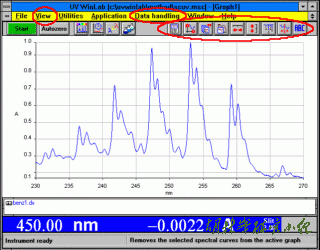
14. For expanding or zooming in on a region, look at the View options from the Menu Bar and see that additional buttons have appeared below it.
It is possible to drag the mouse (left button down) over a region of interest and then double click to enlarge that area.
Vapour above a drop of benzene
15. Text can be added and placed anywhere on the chart and removed again if necessary. See the text (ABC) button and the View options.
16. Peaks can be automatically detected and labelled using the peak button or from the Data-Handling menu option. A dialog box appears for you to set the threshold (i.e. minimum size peak to detect) and the region of interest for the labels.
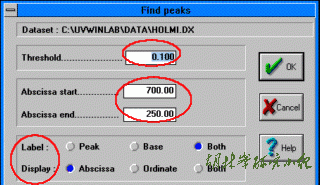
Once this is done, the labels appear on your chart.
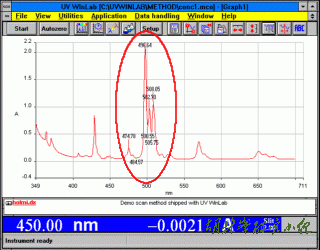
It may be necessary to expand the region to be able to read the peak positions easily.
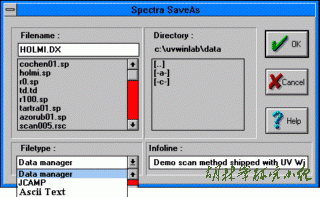
17. To save a spectrum, use File Save or File Save As from the File Menu item. Note that the default file type is compressed (type .SP) and is NOT readable by spreadsheets such as Excel etc. For this, it is necessary to save the data as an ASCII file or you can use the LIST function from the Datahandling Menu option and then copy the data to the spreadsheet directly.
Another alternative is to use the data exchange standard established by the IUPAC committee called the Joint Committee for Atomic and Molecular Data Exchange (JCAMP-DX) and save your data as JCAMP files.
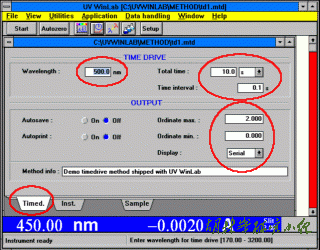
For measuring Absorbance at one wavelength versus time, set your required wavelength and times. Then check the Instrument and sample setting windows as for a normal scan.
Wavelength scan
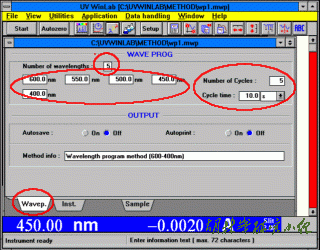
This method is used for reports of Absorbance at up to 16 different wavelengths. The screen shows five wavelengths selected (600-400 nm) for 5 repeat readings. Next, check the Instrument and sample setting windows as for a normal scan.
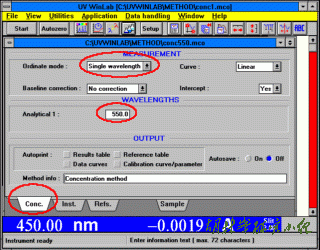
To create a standard curve of Absorbance versus concentration, first set your required wavelength. Then check the Instrument and sample setting windows as for a normal scan.

以下内容转载自小木虫 哥特复兴VS [1]Han-Dong Sun,Yi-Ming Shi:LCUV-Guided Isolation and Structure Determination of Lancolide E: A Nortriterpenoid with a Tetracyclo [...

同一种微生物在不同的国家或地区常有不同的名称,这就是俗名。俗名在局部地区可以使用,但不便于交流,容易引起混乱。为在世界范围...
1 目的 规范TENSOR 27红外光谱仪的操作程序,正确使用仪器,保证设备安全和检测的顺利进行。 2 使用环境 电源电压:85~265V,47~65Hz 温度范...

人是能够思想的苇草 帕斯卡尔 人只不过是一根苇草,是自然界最脆弱的东西;但他是一根能思想的苇草。用不着整个宇宙都拿起武器来才能...