发布日期:2020-11-16 12:23 浏览次数:
Wenjin Hu,Xinli Pan,Hafiz Muhammad Khalid Abbas,Fengfeng Li,Wubei Dong
Abstract
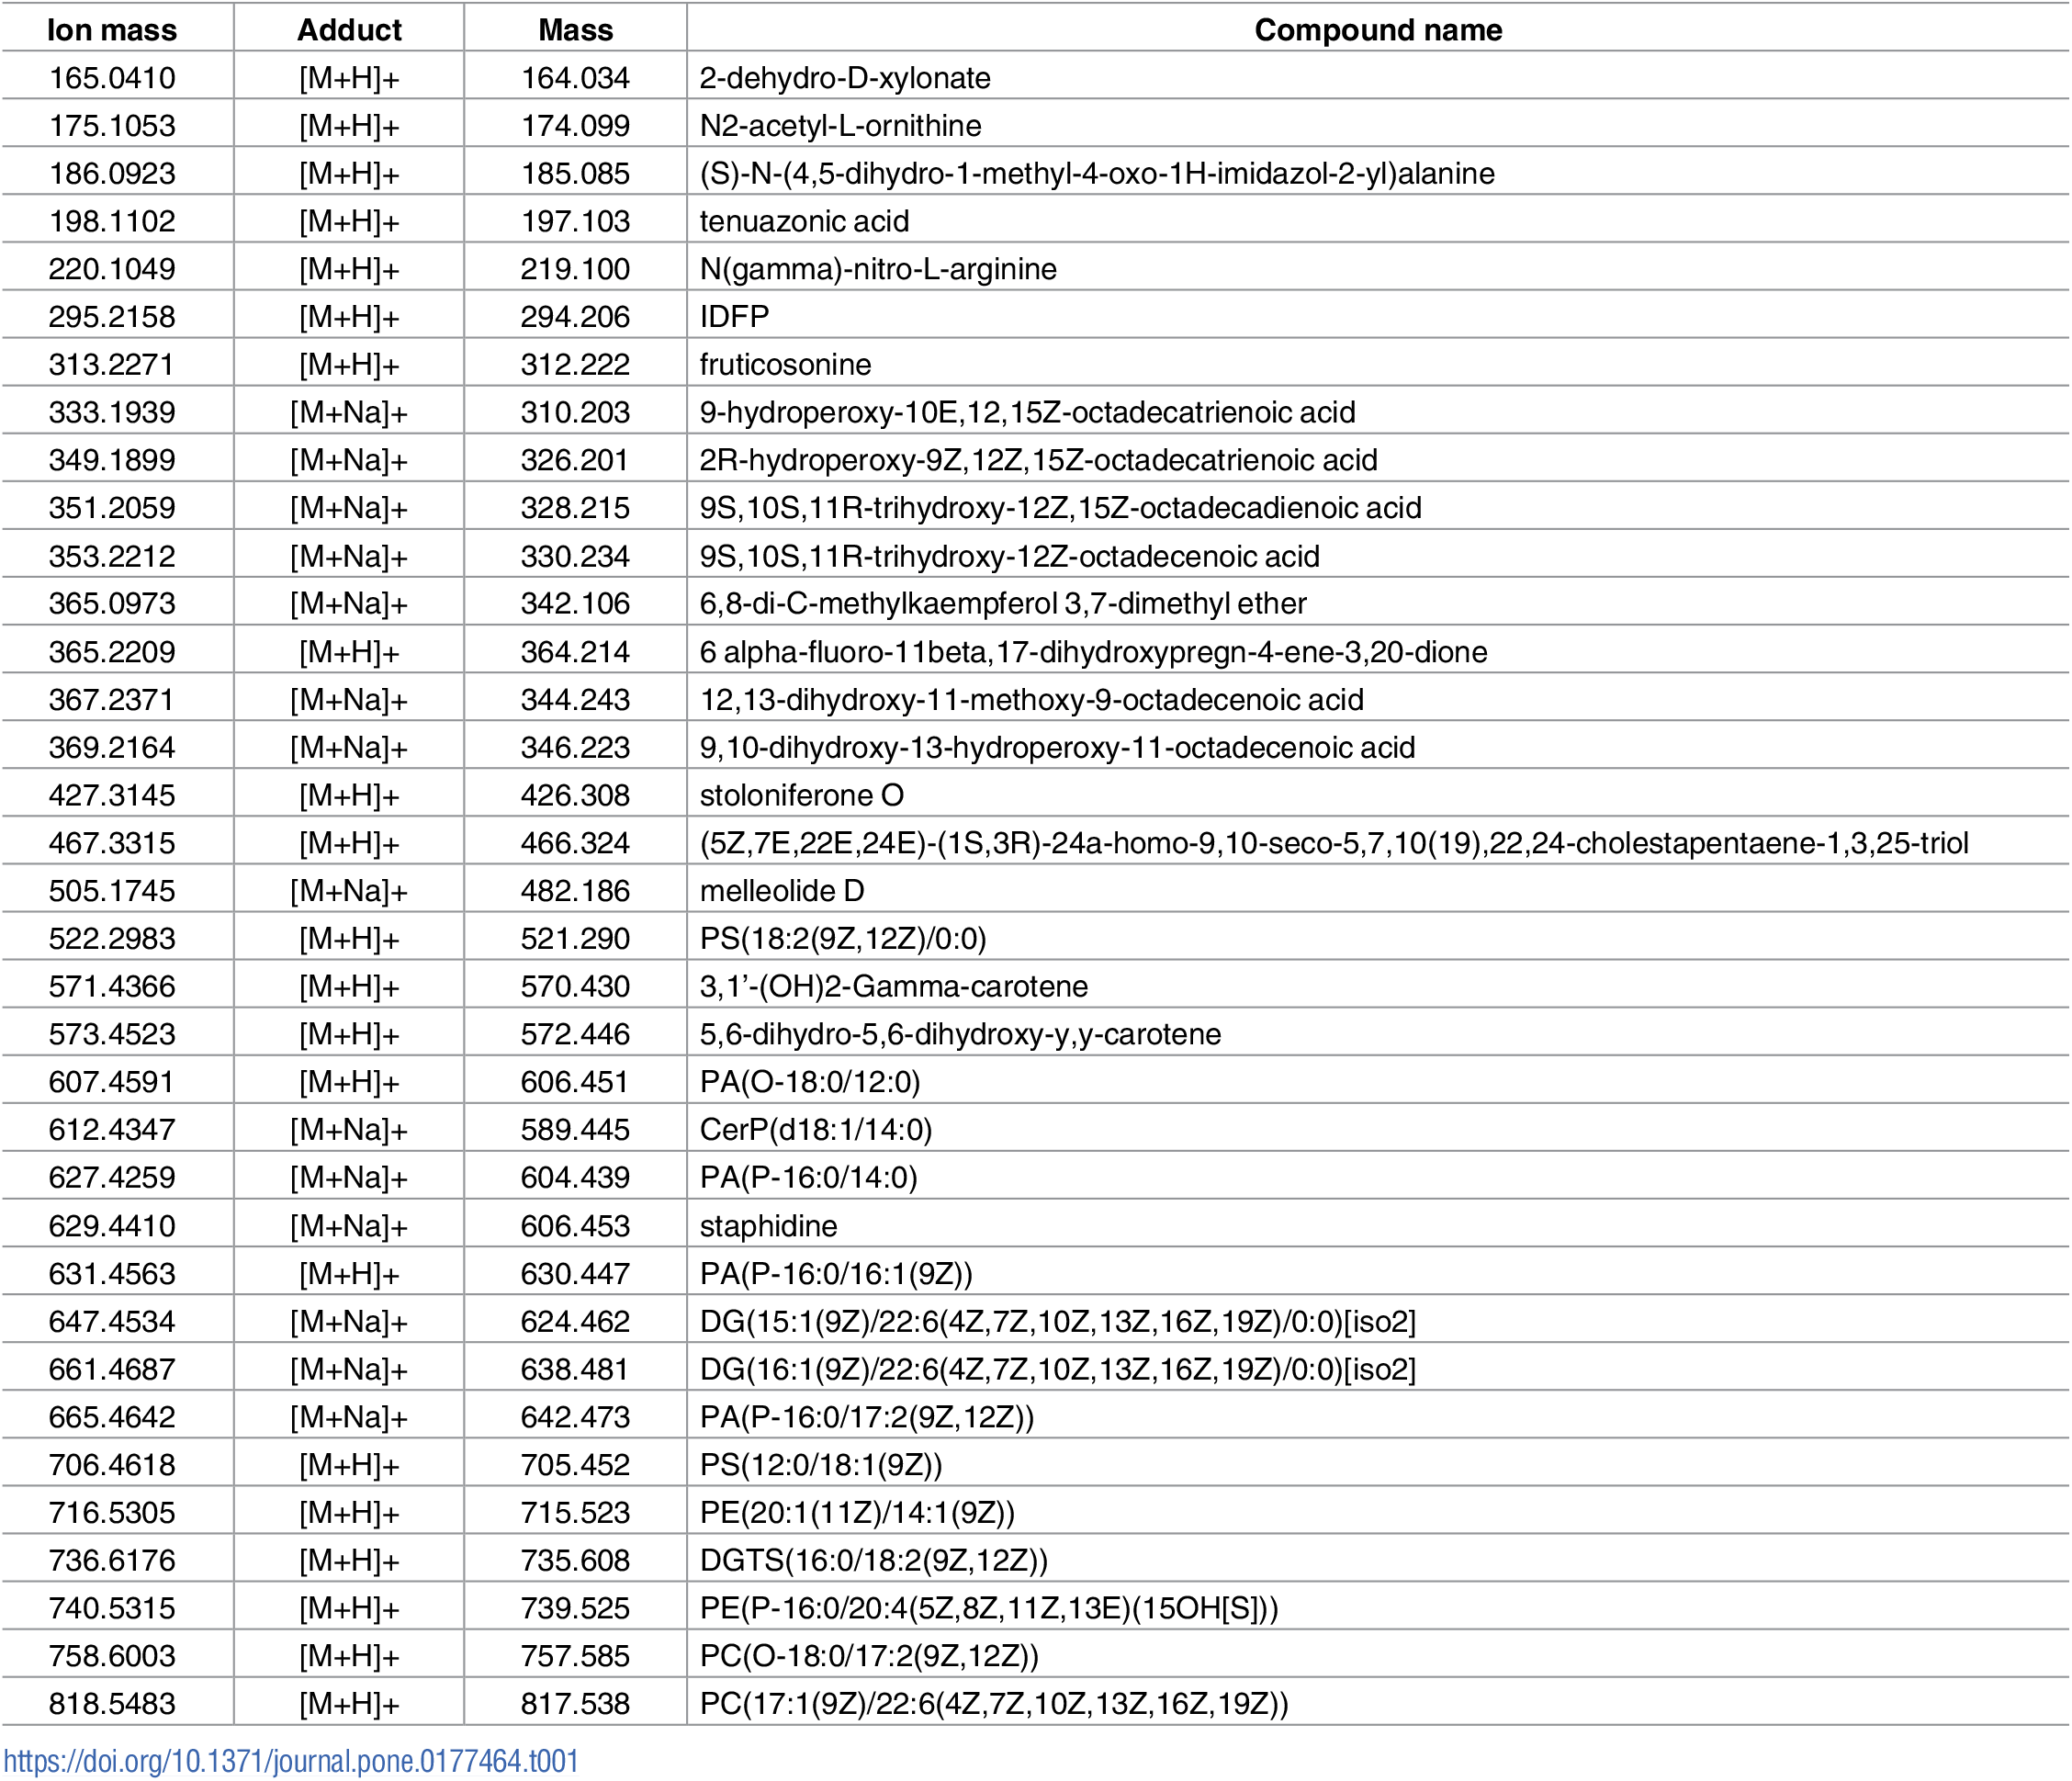
Rhizoctonia solani is a causative agent of sheath blight, which results in huge economic losses every year. During its life cycle, the formation of sclerotia helps Rhizoctonia solani withstand a variety of unfavorable factors. Oxidative stress is a key factor that induces sclerotium formation. The differentiated and undifferentiated phenotypes of R. solani AG-1-IA were obtained by controlling aerial conditions. Metabolomics based on the mass spectrometry technique combined with multivariate and univariate analyses was used to investigate the metabolic variation in vegetative, differentiated and undifferentiated mycelia. Our results revealed that during maturation, the metabolic levels of N2-acetyl-L-ornithine, 3,1'-(OH)2-Gamma-carotene, (5Z,7E)-(1S,3R)-24,24-difluoro-24a-homo-9,10-seco-5,7,10(19)-cholestatrien-1,3,25-triol, stoloniferone O, PA(O-18:0/12:0), PA(P-16:0/14:0), PA(P-16:0/16:(19Z)) and PA(P-16:0/17:2(9Z,12Z)) were suppressed in both differentiated and undifferentiated mycelia. The concentrations of PE(20:1(11Z)/14:1(9Z)), PE(P-16:0/20:4(5Z,8Z,11Z,13E)(15OH[S])) and PS(12:0/18:1(9Z)) were increased in the differentiated group, while increased levels of N(gamma)-nitro-L-arginine, tenuazonic acid and 9S,10S,11R-trihydroxy-12Z,15Z-octadecadienoic acid were found in the undifferentiated group. Our results suggest that different levels of these metabolites may act as biomarkers for the developmental stages of R. solani AG-1-IA. Moreover, the mechanisms of sclerotium formation and mycelium differentiation were elucidated at the metabolic level.
https://doi.org/10.1371/journal.pone.0177464

G1: Culturing 36 hours post-inoculation while sealing the plate with a layer of preservative film. G2: Culturing 60 hours post-inoculation while sealing the plate with a layer of preservative film continuously. G3: Culturing 60 hours post-inoculation without sealing the plate beginning from 48 hours to 60 hours (the preservative film was removed at 48 hours). Differentiated sclerotia were formed in G3 due to unlimited aeration. After 48 hours of growth, the mycelia reached the edge of the Petri dish, but at 60 hours, the mycelia remained undifferentiated in G2 due to isolated aeration.

(A): Score plots based on the first two components (PC1 vs PC2) derived from the PCA results. (B), (C) and (D): Score plots based on the first two latent components derived from the corresponding PLS-DA model for the three comparisons (G2 vs G1, G3 vs G1 and G3 vs G2). According to the paired comparison, the separation between every two groups was clear. The R2X, R2Y, Q2Y and RMSEE values in the PLS-DA models for groups G2 and G1 were 65.1%, 97.6%, 93.9% and 0.022, respectively. The R2X, R2Y, Q2Y and RMSEE values in the PLS-DA models for groups G3 and G1 were 71.7%, 98.9%, 97.1% and 0.012, respectively. The R2X, R2Y, Q2Y and RMSEE values in the PLS-DA models for groups G3 and G2 were 61.5%, 98.1%, 87.8% and 0.02, respectively. The ellipse for each group represented Hotelling’s T2 95% confidence interval.