Keywords:
Streptomyces; wheat; salt stress; microbial community; soil nutrients
Accepted: 19 December 2023
https://doi.org/10.3390/agronomy14010039
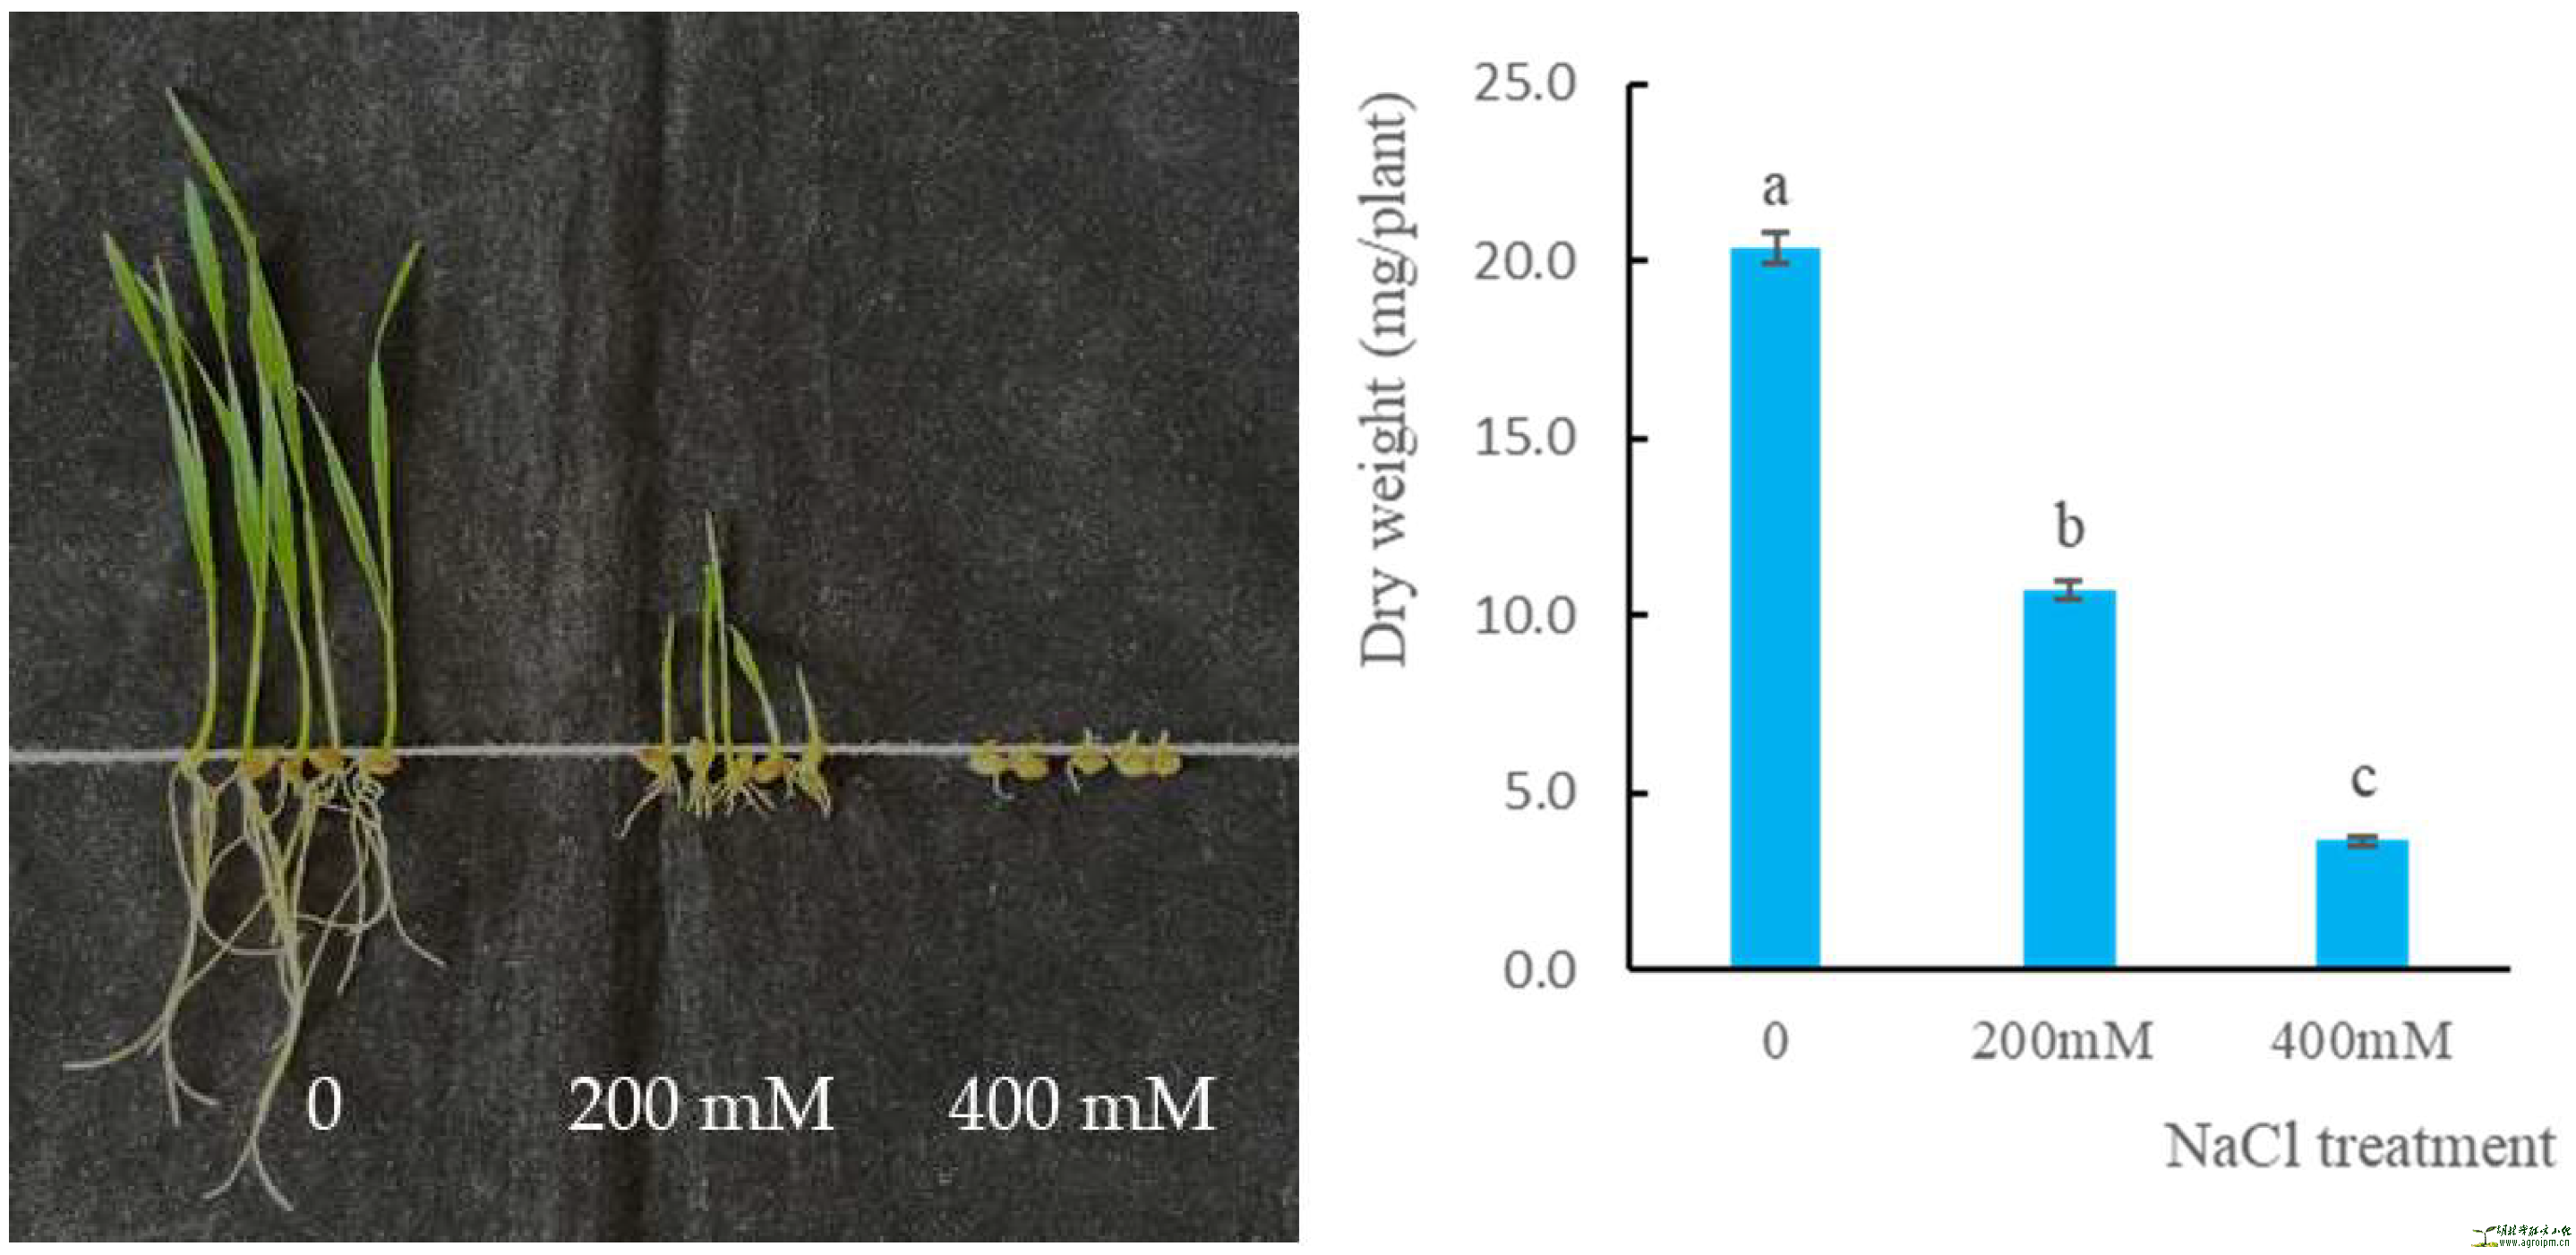
Figure 1. Wheat growth and dry weight under different concentrations of NaCl. The data are presented as the mean ± SD of three independent replicates. Lowercase letters indicate significance (p < 0.05) among different treatments.
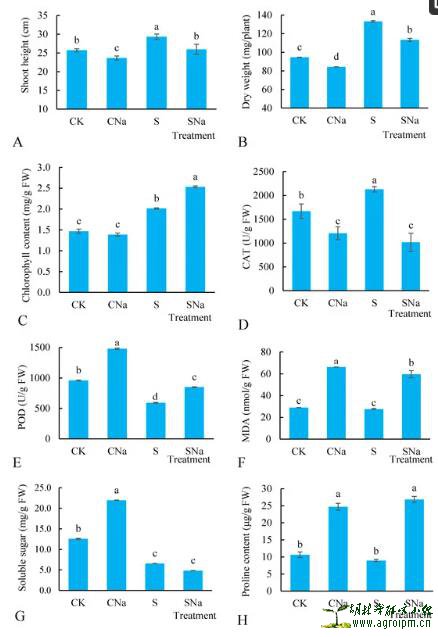 Figure 2.
 Wheat physicochemical properties (
A–
H). CK, CNa, S, and SNa represent control soil, NaCl soil, HU2014 soil, and inoculated HU2014 soil with the addition of NaCl, respectively. CAT represents catalase. POD represents peroxidase. MDA represents malondialdehyde. The data are presented as the mean ± SD of three independent replicates. Lowercase letters indicate significance (
p < 0.05) among different treatments.
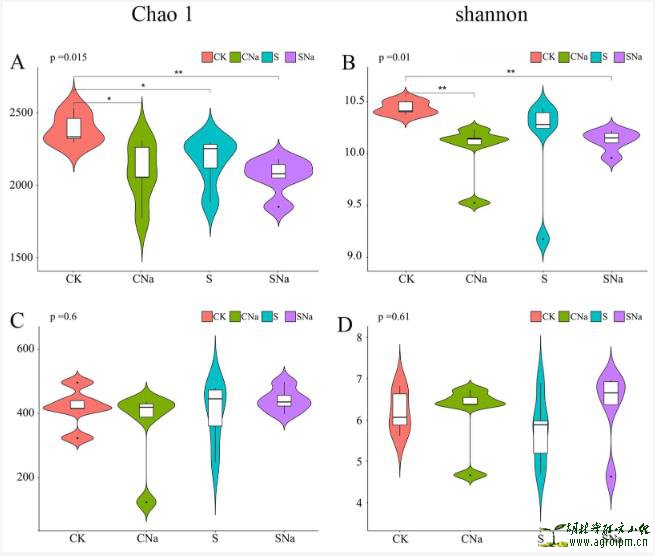 Figure 3.
 Difference in bacterial (
A,
B) and fungal (
C,
D) alpha diversity among the treatments. (The data are presented as the mean ± SD of three independent replicates. CK, CNa, S, and SNa represent control soil, NaCl soil, HU2014 soil, and inoculated HU2014 soil with the addition of NaCl, respectively.) Asterisks indicate significant differences (
p < 0.05) between treatments.

Figure 4. Non-metric multidimensional scaling ordination plots derived from the Bray–Curtis distance matrix (A,C) and relative abundance of the dominant bacterial (B) and fungal (D) taxa in different treatments. CK, CNa, S, and SNa represent control soil, NaCl soil, HU2014 soil, and inoculated HU2014 soil with the addition of NaCl, respectively. The configuration stresses were bacteria 0.05 and fungi 0.15. Samples are clustered together by different treatments.
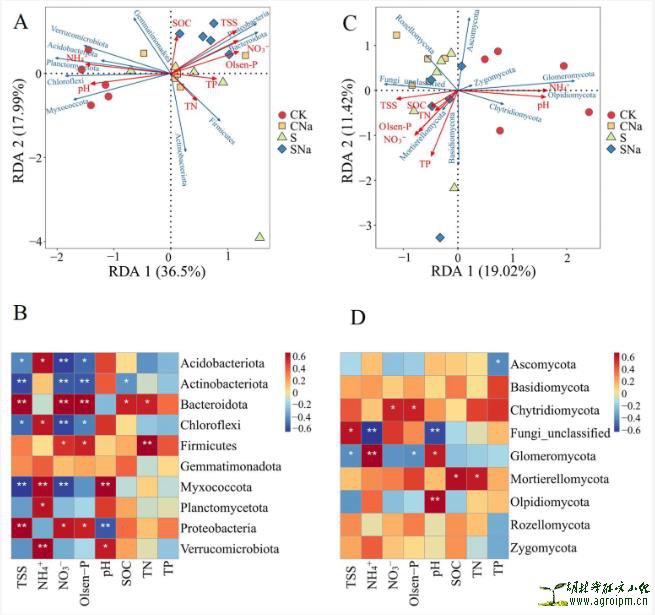 Figure 5.
 Redundancy analysis (
A,
C) and correlation heat map of microbial taxa with soil properties (
B,
D). TSS: total soluble salt; NH
4+: NH
4+-N content; NO
3−: NO
3−-N content; Olsen-P: Olsen-P content; SOC: soil organic carbon content; TN: total nitrogen content; and TP: total phosphorus content. * Correlation is significant at
p < 0.05 (two tailed); ** Correlation is significant at
p < 0.01 (two tailed).