Spectrophotometric analysis of bioactive metabolites and fer
发布日期:2023-03-31 10:39
来源:研究小组
作者:AgroIPM
浏览次数:
Spectrophotometric analysis of bioactive metabolites and fermentation optimisation of Streptomyces sp. HU2014 with antifungal potential against Rhizoctonia solani
Hongxia Zhu,Linfeng Hu,Tetiana Rozhkova,Xinfa Wang &Chengwei Li
Abstract
Streptomyces spp. produce a range of secondary metabolites that can inhibit phytopathogen growth. This study aimed to optimise the environmental and nutritional parameters for improving the production of antifungal components by Streptomyces sp. HU2014 through statistical approaches. Spectrophotometry and bioassay revealed that two fractions, F6 and F8, from the cell-free filtrates of HU2014 culture broth were rich in antifungal compounds. Subsequently, single-factor experiments were conducted using glucose-peptone-yeast extract medium as basal medium, and the effects of different parameters on the production of bioactive metabolites by Streptomyces sp. HU2014 were evaluated and optimised using shake-flask experiments as follows: incubation time, 10 days; temperature, 25 °C; agitation speed, 150 rpm; inoculum size, 5% (v/v); initial pH, 7.0; and medium composition, dextrin, yeast extract and KNO3. The central composite face-centred design from response surface methodology predicted 39.6 g/L dextrin, 8.5 g/L yeast extract and 2.5 g/L KNO3 as the optimum medium composition. The validation experiment confirmed that a 50-fold dilution of the optimised filtered fermentation broth of the strain culture showed an increase of 14.9% in the inhibition of Rhizoctonia solani YL-3 when compared with the basal medium. A good correlation between measured and predicted values of the model validated both the responses. Thus, the present study used statistical optimisation to improve the bioactive metabolites productivity in Streptomyces sp. HU2014.
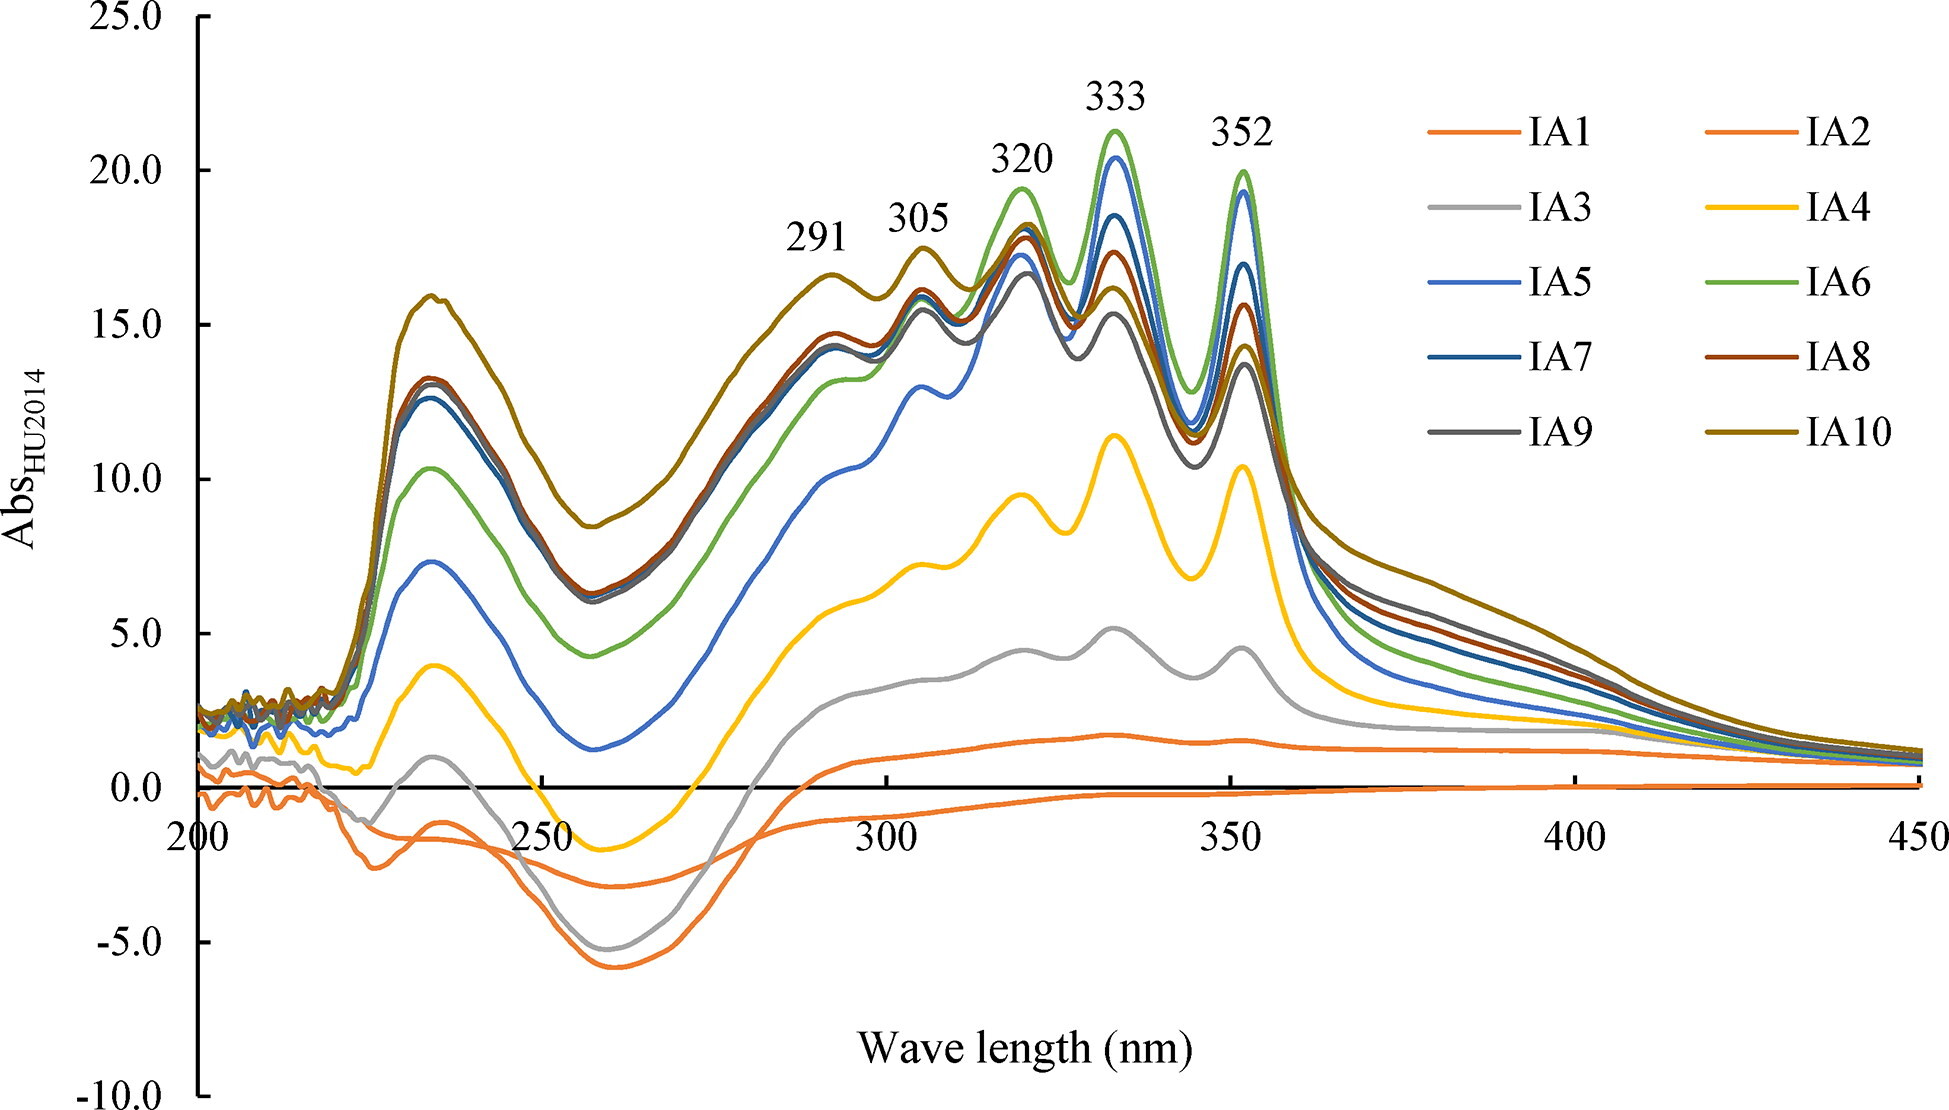 Scanning broad spectrum of four fractions extracted from the cell-free filtrates of HU2014 culture broth by spectrophotometry
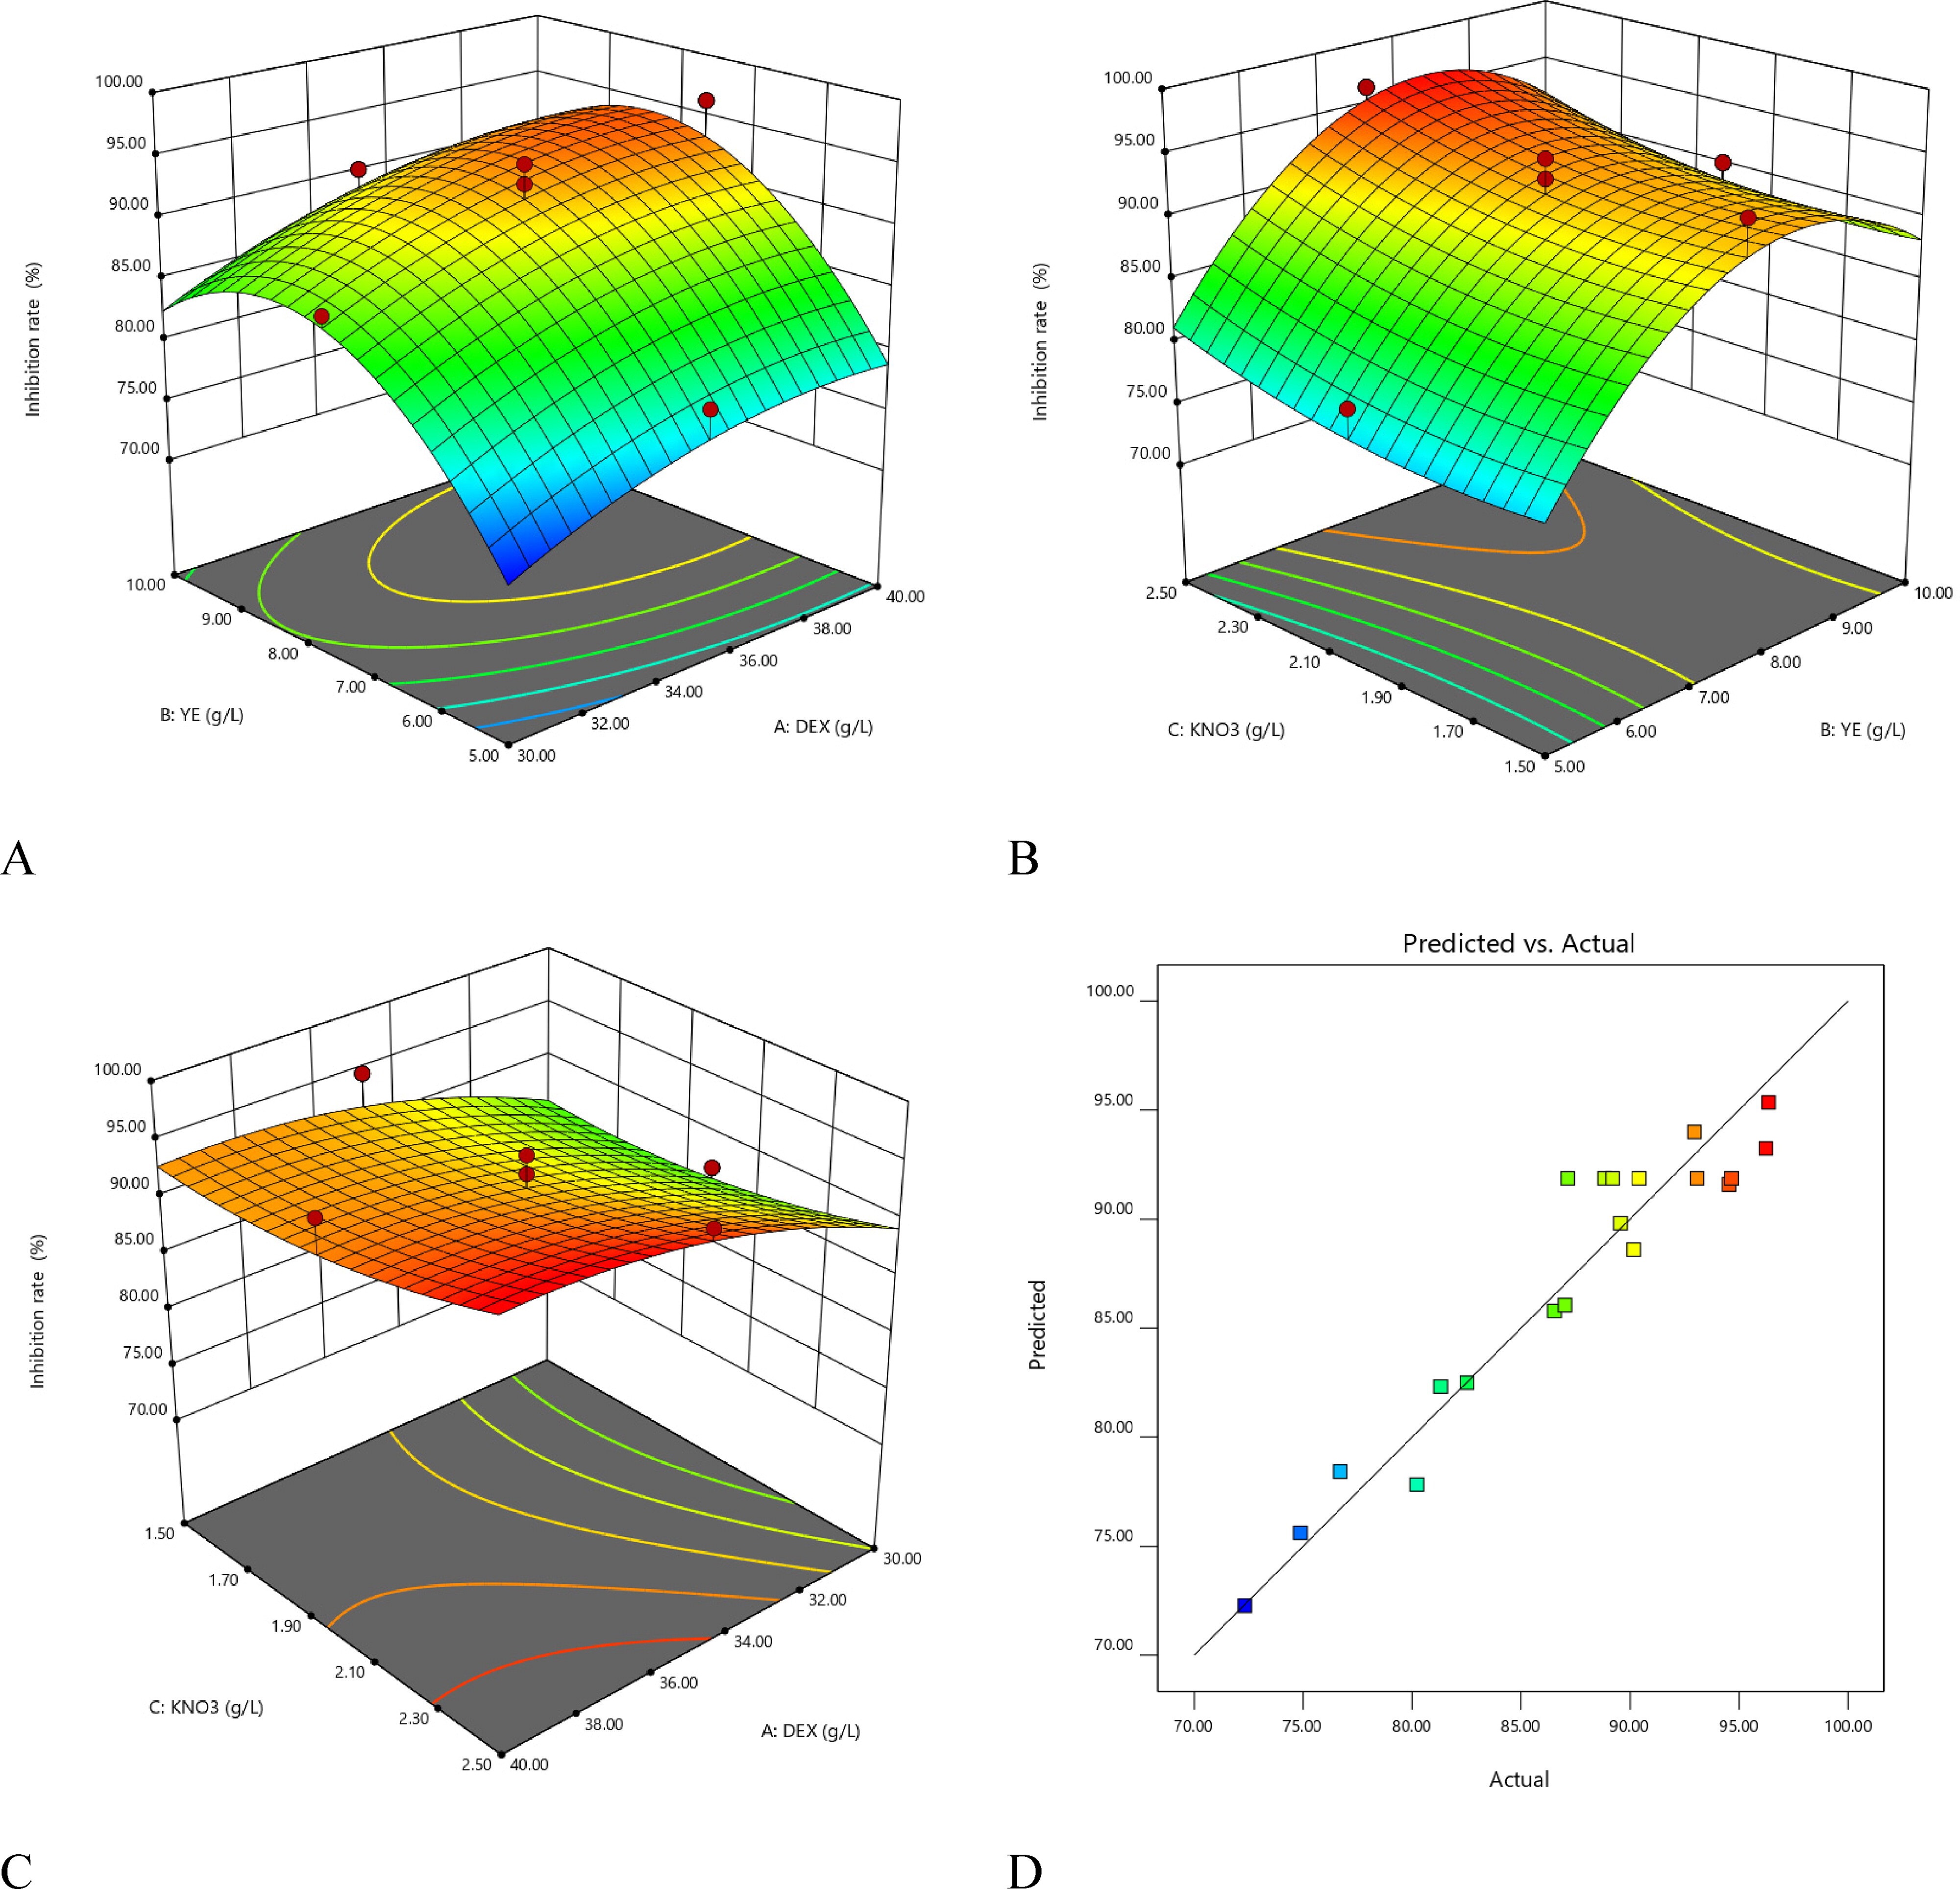
3D surface plot for the inhibition rate. (A) Nitrogen source and Carbon source; (B) Nitrogen source and inorganic salt; (C) Carbon source and inorganic salt. (D) Actual vs. predicted values plot for the inhibition rate. Abbreviation: DEX represents dextrin, YE represents yeast extract.