|
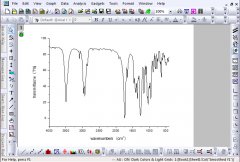
Origin is a software application with tools for data analysis, publication-quality graphing, and programming.
Visit our Top Features page to find out what's new in the latest version.
Data Analysis
Origin contains powerful tools for all of your analytic needs, including peak analysis, curve fitting, statistics, and signal processing. To make data analysis more efficient, Origin supports many common formats for importing data, and exporting results. Multi-sheet workbooks and an integrated Project Explorer help you organize your Origin projects. Streamline your workflow by saving workbooks as analysis templates for repeat use.
Graphing
With over 70 built-in graph types, Origin makes it easy to create and customize publication quality graphs to suit your needs. Many popular contour, 2D, and 3D graph types are supported, as are specialty graphs such as windrose, stock (OHLC), ternary (including ternary-contour), 2D vector and 3D vector, and several statistical plots.
Programming
Origin includes two built-in programming languages: Origin C, a C-based compiled language, and a scripting language called LabTalk™. Use them to automate graphing and analysis. Origin comes with an Integrated Development Environment (IDE), Code Builder , that makes it easy to write and debug your own code. Origin is also an Automation Server for users of VB, C++, C# and LabVIEW™.
|
Curve Fitting
Share one or more parameters when fitting
multiple curves, and apply bounds and
linear constraints to any fit curve
Peak Analysis
Automatically find multiple peaks and
report their significant parameters
Graphing
Apply transparency to graph elements for
clear display of overlapping data
|


