(A): Score plots based on the first two components (PC1 vs PC2) derived from the PCA results. (B), (C) and (D): Score plots based on the first two latent components derived from the corresponding PLS-DA model for the three comparisons (G2 vs G1, G3 vs G1 and G3 vs G2). According to the paired comparison, the separation between every two groups was clear. The R2X, R2Y, Q2Y and RMSEE values in the PLS-DA models for groups G2 and G1 were 65.1%, 97.6%, 93.9% and 0.022, respectively. The R2X, R2Y, Q2Y and RMSEE values in the PLS-DA models for groups G3 and G1 were 71.7%, 98.9%, 97.1% and 0.012, respectively. The R2X, R2Y, Q2Y and RMSEE values in the PLS-DA models for groups G3 and G2 were 61.5%, 98.1%, 87.8% and 0.02, respectively. The ellipse for each group represented Hotelling’s T2 95% confidence interval.


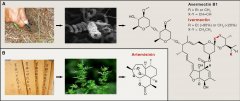
Ben Shen DOI: http://dx.doi.org/10.1016/j.cell.2015.11.031 The 2015 Nobel Prize in Physiology or Medicine has been awarded to William C. Campbell, Satoshi Omura, and Youyou Tu for t...

Self-Fueled Biomimetic Liquid Metal Mollusk Authors Jie Zhang, Youyou Yao, Lei Sheng, Jing Liu Abstract A liquid metal motor that can eat aluminum food and then move spontaneously a...

遗传, 2018, 40(10): 874-887 doi: 10.16288/j.yczz.18-169 综述 中国丝状真菌次级代谢分子调控研究进展 潘园园,1, 刘钢,1,2 1. 中国科学院微生物研究所,真...

Xiangtao Meng a , b , Kevin J. Edgar a , b , , a Macromolecules and Interfaces Institute, Virginia Tech, Blacksburg, VA 24061, United States b Department of Sustainable Biomaterials...